
Plots data across geographical regions onto a map.
Can be used with countries/regions, states, counties or postal codes.
Links to online geography data types to convert categories into recognized values.
Data Format
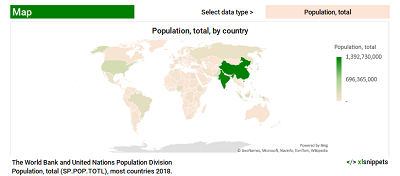
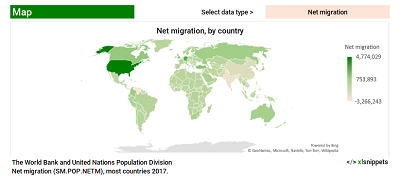
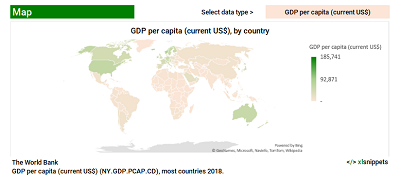
- x-axis: Categories (e.g. countries)
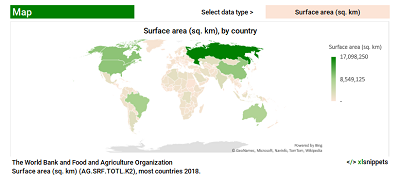
- Categories are color-coded on the map.
- y-axis: Data Series (e.g. population or GDP per capita)
- Series are plotted onto the map and color-coded according to a numeric scale.
| Series | |
|---|---|
| Category 1 | # |
| Category 2 | # |
| Category 3 | # |
Try it now!
- Select a data type using the dropdown list to generate the relevant map.
- The chart, title and values adjust to reflect the data for each country.
- In the event the embedded map does not display, static images are provided below.
 |
 |
 |
 |
- These maps were built using data validation lists, named ranges, conditional statements and the MATCH, OFFSET and VLOOKUP functions.