

Count the number of characters in a string
LEN(text)

Replace one or many instances of specific text based on its content (not on its position).
SUBSTITUTE(text, old_text, new_text, [instance_num])

Plots data as miniature charts within a worksheet cell.
Available in line, column or win/loss formats.
Position Sparklines near data for maximum impact.

Return a random number between 0 and 1
=RAND()

Round a number down to a specified number of digits
=ROUNDDOWN(number, num_digits)

Replace part of a text string based on its position with new text.
REPLACE(old_text, start_num, num_chars, new_text)
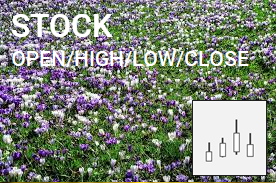
Plots fluctuations in stock prices or other data.
Uses 4 series of values, in order: open, high, low, close.
Data needs to be organized in the correct order.

Return the logical value TRUE if a cell is blank or empty
=ISBLANK(value)

Plots data as a series of color-coded, positive and negative floating columns.
Also known as a bridge chart, shows the impact of additions and subtractions to an initial value.
Useful for visually displaying running totals.

Plots fluctuations in stock prices or other data.
Uses 5 series of values, in order: volume, open, high, low, close.
Data needs to be organized in the correct order.

Return the serial number of a particular date
=DATE (year, month, day)

Returns a vertical array of the most common values in a data set.
=MODE.MULT(number1, [number2], ...)

Plots fluctuations in stock prices or other data.
Uses 4 series of values, in order: volume, high, low, close.
Data needs to be organized in the correct order.

Plots data in order and joins with lines stacked by category to represent 100%.
Track changes or trends over time.
Stacked Line option is also available.

Return the logical value TRUE if the cell contains a number.
=ISNUMBER(value)

Plots data proportional to the sum of items.
Data points shown as a percentage of the whole.
2D and 3D options are available.

Join two or more text strings together.
CONCATENATE(text1, [text2], …)

Return the number of days between two dates
=DAYS(end_date,start_date)

Plots data in horizontal bars.
Make comparisons between discrete categories.
2D and 3D options are available.

Plots data in order and stacked by category to represent 100%.
Joins data with lines and a filled area below.
Track changes or trends over time.
Register (for free!) or Login to access bonus materials
About xlsnippets
Learn how to master functions, charts, pivot tables and more using Excel for Microsoft Office 365. Simple instructions and embedded spreadsheets help you practise the basics.
Latest Updates
TEXTJOIN() function
26 March 2022
REPLACE() function
26 March 2022
TEXT() function
26 March 2022
RANK.AVG() function
25 March 2022
CONCAT() function
22 March 2022
Coming soon
xlsnippets.com is currently in beta version. More functions and bonus content for registered users will be added weekly. Detailed training courses with additional downloadable resources are also on the horizon!